How To Find Acceleration Position Vs Time Graph
Ronan Farrow
Feb 24, 2025 · 4 min read

Table of Contents
How to Find Acceleration from a Position vs. Time Graph
Determining acceleration from a position-time graph might seem daunting, but it's a fundamental concept in physics with straightforward applications. This guide will walk you through the process, clarifying the relationship between position, velocity, and acceleration. We'll also explore common pitfalls and provide tips for accurate interpretation.
Understanding the Fundamentals
Before diving into the specifics, let's review some key definitions:
-
Position: An object's location relative to a reference point. On a position-time graph, it's represented on the y-axis.
-
Time: The independent variable, always plotted on the x-axis.
-
Velocity: The rate of change of position. It's the slope of the position-time graph at any given point.
-
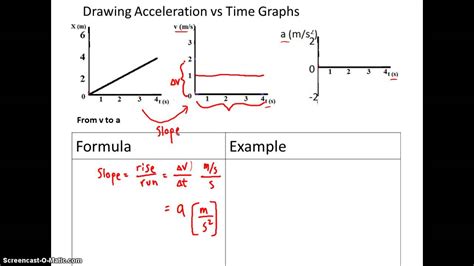
Acceleration: The rate of change of velocity. This means it's the slope of the velocity-time graph. Since we're starting with a position-time graph, we need to find the velocity first.
Finding Velocity from a Position vs. Time Graph
The relationship between position and velocity is crucial. The velocity at any point on a position-time graph is given by the slope of the tangent line at that point.
Method 1: Calculating the slope for straight line segments
If your position-time graph is a straight line (or comprised of straight line segments), calculating velocity is easy:
-
Choose two points on the straight line segment. Let's call them (t₁, x₁) and (t₂, x₂), where 't' represents time and 'x' represents position.
-
Calculate the slope: The slope, which represents the average velocity over that time interval, is (x₂ - x₁) / (t₂ - t₁). Remember, a positive slope indicates positive velocity (movement in the positive direction), and a negative slope indicates negative velocity (movement in the negative direction).
-
Repeat for other segments: If the graph has multiple straight line segments, repeat this process for each segment to obtain the velocity for each interval.
Method 2: Determining the instantaneous velocity for curves
For curved position-time graphs, the velocity is constantly changing. To find the instantaneous velocity at a specific point:
-
Draw a tangent line: At the point of interest on the curve, draw a line that just touches the curve at that single point. This line represents the instantaneous velocity at that moment.
-
Calculate the slope: Calculate the slope of the tangent line using the same method as above (choosing two points on the tangent and finding the slope).
-
Repeat for different points: Repeat steps 1 and 2 for different points along the curve to get the velocity at different times.
Finding Acceleration from the Velocity vs. Time Graph (derived from the position-time graph)
Once you have determined the velocity at various points (either by calculating slopes of straight segments or tangents to curves from the position-time graph), you can plot these velocities against their corresponding times to create a velocity-time graph. Now you can find the acceleration:
-
Plot the Velocity-Time Graph: Create a new graph with velocity on the y-axis and time on the x-axis, using the data you collected from the position-time graph.
-
Calculate the slope: The acceleration is the slope of this velocity-time graph. If the velocity-time graph is a straight line, calculate the slope using the same method as described above. If it is curved, use the tangent line method to find the instantaneous acceleration at specific points.
-
Interpret the results: A positive slope indicates positive acceleration (speeding up), a negative slope indicates negative acceleration (slowing down), and a slope of zero indicates constant velocity (no acceleration).
Common Mistakes to Avoid
-
Confusing slope and y-intercept: Remember the y-intercept represents the initial position, not the velocity or acceleration.
-
Incorrect tangent lines: When drawing tangents to curves, make sure the line only touches the curve at the single point of interest.
-
Units: Always keep track of your units (e.g., meters, seconds, meters per second, meters per second squared).
By following these steps carefully, you can effectively determine acceleration from a position-time graph. Remember, practice makes perfect! The more you work with these graphs, the more intuitive the process will become.
Featured Posts
Also read the following articles
| Article Title | Date |
|---|---|
| How To Hide Taskbar Kde | Feb 24, 2025 |
| How To Make Fried Rice Cauliflower | Feb 24, 2025 |
| How To Buy Bitcoin Etf In Uk | Feb 24, 2025 |
| How To Get Rid Of Acne Scars Easily | Feb 24, 2025 |
| How To Lower Cholesterol Harvard | Feb 24, 2025 |
Latest Posts
Thank you for visiting our website which covers about How To Find Acceleration Position Vs Time Graph . We hope the information provided has been useful to you. Feel free to contact us if you have any questions or need further assistance. See you next time and don't miss to bookmark.
